Remote sensing
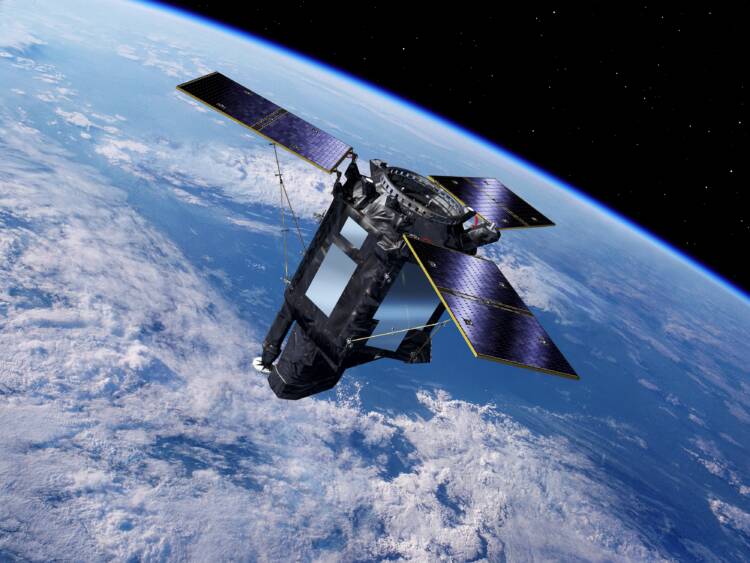
Remote sensing enables the collection of spatial data about the target area without physical contact. Data collection can occur from satellites, aircraft, or ground-based devices.

On this page:
- Remote sensing
- Passive remote sensing
- Active remote sensing
- Usability and availability of satellite data in terms of nature monitoring
- References
Remote sensing
Remote sensing involves collecting spatial information about a target without physical contact. This is achieved using either satellites or aircraft (such as airplanes, helicopters, hot air balloons, or drones) equipped with various instruments. The diverse methods of remote sensing are applicable to mapping, measuring, and repetitive monitoring of nature.
In a broader sense, ground-based observations made using remote sensing instruments can also be included. In many remote sensing applications, such as mapping and monitoring of natural habitats, field observations are an essential part of the data collection process.
Remote sensing satellites are owned by both governments and private companies. A single satellite may carry multiple instruments with varying resolutions and purposes, collecting data using different techniques. The same applies to aircraft, including airplanes and drones. Because of this, the following paragraphs are organized based on the method of remote sensing (either passive or active) and then by the type of imaging platform (satellites or aircraft).
Passive remote sensing
Passive remote sensing, also known as optical remote sensing, is a method in which an imaging instrument attached to a satellite or aircraft captures electromagnetic radiation reflected or emitted by the target across different wavelength ranges. It is called “passive” because the remote sensing instrument utilizes solar-derived electromagnetic energy. At its simplest, passive remote sensing refers to traditional aerial photography using visible light (red, green, blue) from an airplane, but the same technique can also be applied using satellites.
If the instrument can collect signals from other wavelength ranges beyond visible light, it is referred to as multispectral remote sensing. When the instrument’s spectral resolution extends to several tens or hundreds of different wavelength bands, it is known as hyperspectral remote sensing.
The term “false-color imaging” is somewhat misleading and outdated, having been used during the era of film cameras. Nowadays, for contemporary users, false-color imagery typically denotes a channel combination that allows visualization of the image using “false colors” not visible to the human eye. This can include channels beyond the visible light spectrum, such as near-infrared.

Application of passive remote sensing in natural habitat monitoring
Satellite-based remote sensing enables continuous and systematic mapping and research of natural areas, including the monitoring of different habitat types, on a global scale. By using satellite image time series, it is possible to investigate changes in habitat conditions, dating back to the mid-1970s.
When the satellite imaging conditions are well understood, and the instruments are properly calibrated, remote sensing can collect essential bio-physical variables related to vegetation and habitat monitoring across various scales. These variables include descriptors of canopy structure (such as Leaf Area Index, biomass, and vegetation cover) and biochemical properties (such as leaf pigmentation, moisture content, and chlorophyll levels).
Both satellite and aircraft imaging instruments can derive various radiometric indices from their channels. These indices allow the highlighting of specific features, such as vegetation or soil moisture. Interpreting and comparing intuitive radiometric indices is often easier than interpreting channel-specific pixel values. These indices are scaled to specific value ranges and can be applied across images captured by different instruments, provided the correct channels are available.
Temporal comparison of index values is a versatile method for habitat monitoring. For instance, in the joint Ylä-Lappi project by Metsähallitus and SYKE, the NDVI (Normalized Difference Vegetation Index) was used to identify lush and nutrient-rich habitat types based on the maximum value during the growing season.
Characteristics of satellites in terms of monitoring natural habitats
Spatial resolution of openly available satellite data (ranging from 10 to 30 meters) is often too coarse for many small-scale habitat types and specific terrain features. Consequently, satellite data provide better insights at a broader habitat type level. For instance, in the Ylä-Lappi project, the focus was on extensive and relatively homogeneous habitat types, such as fell heaths and birch forests.
Challenges commonly encountered include the limited ability of many instruments to detect subtle changes in radiation wavelength (spectral resolution) and to differentiate small variations in measured radiation intensity (radiometric resolution). Additionally, a critical challenge, especially in Finland’s climate conditions, is the temporal resolution of satellite imagery—how frequently the satellite captures the same area.
In Finland, the growing season is short, and the prevailing weather is often cloudy or partly cloudy. Consequently, monitoring short-term changes in habitat types can be challenging if only a few usable satellite images are available during the growing season. Furthermore, from late autumn to early spring, the sun’s low angle results in geometric limitations that prevent the acquisition of many satellite images from Finland.
Satellite types for natural habitat monitoring
Satellites with coarse spatial resolution
Satellites with coarse spatial resolution (over 100 meters) are utilized for habitat monitoring on a global scale. However, they should not be overlooked in national monitoring efforts, especially when long and harmonized time series are needed, and landscape-level accuracy suffices.
The most well-known and widely used satellite system is NASA’s Moderate Resolution Imaging Spectroradiometer (MODIS). There are two MODIS satellites: Terra, operational since 1999, and Aqua, operational since 2002. The spectrometers on MODIS satellites capture data across 36 different wavelength bands, with a spatial resolution ranging from 250 to 1000 meters. Despite not being commonly perceived as such, MODIS is a hyperspectral imaging instrument. While Terra and Aqua satellites are nearing the end of their operational lifetimes, new imagery is expected until around 2025-2026.
In addition to raw satellite images, there are numerous pre-processed image products available. These cover various aspects, including land surface temperature, primary productivity, burned areas, vegetation indices, and assessments of snow, ice, and marine conditions.
Satellites with high spatial resolution
High spatial resolution (10-100 meters) satellites are likely the most versatile for monitoring habitat types. The most well-known and still operational ones are NASA’s Landsat program satellites and the European Space Agency’s Sentinel-2 satellites.
Landsat has become a reliable tool for environmental monitoring over decades. Its ground resolution is suitable for various purposes, carefully designed wavelength bands, and relatively large image size (approximately 170 x 183 km). Researchers have free access to the entire Landsat image archive dating back to the 1970s.

The European Space Agency’s (ESA) Sentinel-2a (since 2015) and Sentinel-2b (since 2017) satellites feature a multispectral imaging instrument similar to Landsat. They can capture radiation across 13 different channels, with spatial resolution ranging from 10 to 60 meters, depending on the channel. From Finland, images are available approximately every five days, covering an area as large as 290 x 290 km.
In addition to Landsat-like capabilities, Sentinel-2 stands out by collecting radiation in the Red Edge wavelength range (approximately 700-790 nm) using three additional channels. This provides additional opportunities for monitoring habitat types. However, Sentinel-2 lacks the thermal channels found in Landsat and the panchromatic channel. Additionally, the Sentinel-2 time series is significantly shorter. A third Sentinel-2 satellite is planned for launch into orbit in 2024, further improving image availability.
Numerous commercial service providers operate satellites that utilize passive remote sensing methods for capturing so-called Very High Resolution (VHR) satellite images. The spatial resolution of these images can vary from a few tens of centimeters to approximately five meters, depending on the terrain. Additionally, some service providers operate constellations of tens or hundreds of small satellites capable of both high spatial and high temporal resolution, allowing for daily imaging of the same area.
VHR imagery provides detailed information about qualitative changes in habitat types, even over short time intervals. However, similar to aerial imagery, the coverage area of a single image is relatively small, and achieving homogeneous image coverage over large areas in Finland’s conditions can be challenging. Furthermore, as a compromise for very high spatial resolution, the spectral resolution may be coarser due to the absence of longer wavelength channels. Additionally, the current pricing policies for VHR imagery do not yet support widespread operational monitoring.
Passive remote sensing using satellites relies on measuring the electromagnetic radiation reflected by land and water surfaces across different wavelengths (reflectance). However, part of this radiation is emitted back into the atmosphere and detected by sensors as thermal infrared radiation (emission).
Emission has long been applied for various purposes, including measuring and monitoring land and water surface temperatures, forest fires, evapotranspiration, and albedo. It is essential to note that sensors can only measure surface temperatures, and information about subsurface temperatures, especially for dense canopies or small habitat types, is not obtainable.
Passive Remote Sensing from Aircraft
Aircraft-based passive remote sensing offers flexibility in terms of imaging location and timing, as well as high spatial resolution. However, it is not well-suited for large-scale operational habitat monitoring due to high costs and the small coverage area of images. Additionally, variations in imaging geometry, atmospheric conditions, and phenology pose challenges for broad-scale monitoring and create difficulties for artificial intelligence applications.
In the National Aerial Imaging Program of the National Land Survey of Finland, Finland is divided into regions that are imaged by aircraft every three years, except for the northernmost Lapland. Half of the imaging occurs in spring before leaves appear on trees, and the other half in summer when trees are in full foliage. Historical aerial images can be used to examine land use changes.
Techniques used in passive remote sensing
Stereoscopy
In stereoscopy, aerial images are captured by adjusting the camera’s focal length and flight altitude. Typically, aerial images provide higher spatial resolution than satellite images. During imaging, parallel image strips are taken so that consecutive and adjacent images partially overlap.
This ensures the creation of a seamless mosaic from the aerial images. When each object is visible on at least two images, the images have complete stereo coverage, allowing for three-dimensional examination through stereoscopy.
Structure-from-Motion technique
In recent years, alongside stereoscopy, the Structure-from-Motion technique has gained prominence. It allows the creation of photogrammetric point clouds from both old and newly acquired overlapping aerial images. These point clouds serve as the basis for accurate terrain models. The technique has been applied to various scenarios, including geomorphological studies using historical aerial images and assessing forest bio-physical parameters and grassland vegetation height using images captured by drones.
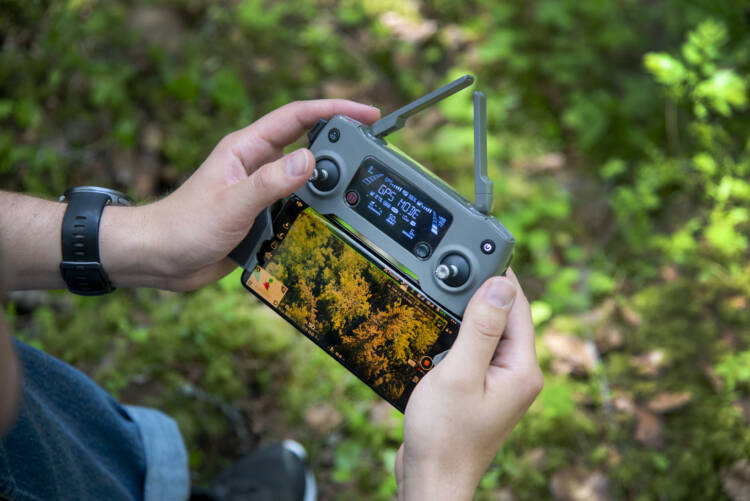
Drones
Drones, also known as UAVs (Unmanned Aerial Vehicles), can be equipped with various passive sensors, from visible light cameras to hyperspectral cameras. Agile drones excel in supporting extensive fieldwork and intensive research, where specific biodiversity features or small areas are investigated. However, there are some drawbacks:
- Limited Coverage Area
- Weather Dependency
- Data Collection and Processing Time
Fixed-wing drones, on the other hand, can cover several square kilometers, expanding their usability beyond traditional quadcopters. However, in Finland, there hasn’t been a specific focus on defining drone data collection to support assessments of endangered habitat types. Nevertheless, the potential for such applications exists.
Hyperspectral Imaging
Hyperspectral imaging utilizes a spectrometer to collect information across the entire electromagnetic spectrum and narrower wavelength bands. This allows for precise characterization of the reflective properties of objects, such as habitat types (Vihervaara et al. 2019).
From the perspective of monitoring natural conditions, this means that we can assess the chemical properties of tree canopy leaves, such as nitrogen or defense compound concentrations. These, in turn, can serve as indicators of forest health. Additionally, hyperspectral data can provide signals that explain functional characteristics of vegetation, including evapotranspiration, carbon sequestration, or litter production. This enables the integration of information into models that describe ecosystem processes.
Hyperspectral imaging allows identifying tree species within the canopy layer with reasonable accuracy, especially when supported by dense-pulse LiDAR data or photogrammetric point clouds. Additionally, Aalto University has developed species-specific spectral libraries that could potentially enhance the identification of tree species and even standing deadwood in the future, although further development is needed. Furthermore, hyperspectral imaging has been used in Northern Finland to identify wetlands, bogs, and fens.
Until recently, hyperspectral data was primarily collected from airplanes, helicopters, and drones. This limited availability has constrained the utilization of hyperspectral data for habitat monitoring due to the high costs and specialized expertise required for organizing such flights. An exception to this trend was the Hyperion instrument aboard NASA’s EO-1 satellite, which operated from 2000 to 2017. Hyperion was used, for instance, in studying the structural diversity of forests, alongside the previously mentioned MODIS instrument.
However, the situation has changed significantly. New satellites equipped with hyperspectral sensors are now operational, with many more in the planning stages. Notably, the German Space Agency’s EnMAP and the Italian Space Agency’s PRISMA satellites are currently in use. Both of these satellites offer a spatial resolution of 30 x 30 meters, although the coverage area remains relatively small at 30 x 30 kilometers.
Finnish Kuva Space has been selected as one of the Copernicus service providers, and they are expected to launch a constellation of over one hundred microsatellites for hyperspectral imaging. Additionally, there are plans for the Copernicus CHIME program and the NASA SBG (Space-Based Hyperspectral Global) mission.
While the data collected by EnMAP and PRISMA is already available for research purposes, the amount of imagery from Finland remains limited. From the perspective of habitat monitoring, the spatial resolution provided by these satellites is still relatively coarse. However, when combined with other remote sensing data and ground observations, the possibilities multiply.
Despite being an exciting development, the utilization of this novel data type for habitat monitoring in Finland has not been thoroughly researched, and its true potential remains untested. Encouragingly, efforts are underway to develop analysis-ready imagery products from EnMAP data, similar to what has been done with Landsat, Sentinel, and MODIS satellites.
Geophysical Low-Altitude Maps by GTK
The Geological Survey of Finland (GTK) geophysical low-altitude maps are suitable for mineral exploration, bedrock mapping, soil investigations, and environmental studies at a regional scale. GTK performed airborne geophysical surveys as low-altitude surveys between 1972 and 2007. The measured geophysical quantities included Earth’s magnetic field, electromagnetic field and natural gamma radiation.
In the joint project for Soil Information Development by the Natural Resources Institute Finland (Luke), the Geological Survey of Finland (GTK), and the universities of Helsinki and Turku, gamma radiation has been utilized to describe the thickness of peat layers. Additionally, electromagnetic maps allow for the study of the impact of power lines, railways, buildings, and other human-made features.
Active remote sensing
In active remote sensing, the instrument itself serves as the radiation source, illuminating the target. The instrument’s sensors emit energy pulses toward the target and record the radiation reflected or scattered back from the object. The most common methods of active remote sensing include radar imaging and laser scanning, also known as Lidar (Light Detection and Ranging).
Active remote sensing from satellites
Synthetic Aperture Radar (SAR), developed as early as the 1950s, is an advanced data collection method. Unlike traditional imaging techniques, SAR is not dependent on sunlight reflection or emission. It operates effectively day and night, and year-round in Finland’s latitudes. One of its key advantages is its ability to capture images under various weather conditions, since radar waves penetrate atmospheric cloud layers.
SAR instruments utilize different wavelengths. Short wavelengths signals (approximately 2-6 cm) only partially penetrate vegetation layers, making them suitable for studying low vegetation. Longer wavelengths signals (approximately 23-60 cm) penetrate more deeply, allowing for measurements related to ecosystem structure, above-ground biomass, and vegetation height.
Despite the significant potential of radar data, applications for monitoring natural habitats have been limited, especially in Finland. Challenges related to data availability, preprocessing, and perceived complexity of analysis have contributed to this situation. However, progress has been made, and SAR time series data is now openly accessible in analyzable formats.
The most useful radar satellites for monitoring natural habitats are the European Space Agency’s Sentinel-1 and the Japan Aerospace Exploration Agency’s ALOS PALSAR (2006-2011) and ALOS-2 (2014-). Among these, Sentinel-1 operates with a short wavelength (C-band), while ALOS and ALOS-2 utilize longer wavelengths (L-band). The resolution varies depending on the imaging mode, ranging from 10 to 100 meters.
Active remote sensing from aircraft and ground-based platforms
Laser scanning is one of the most versatile remote sensing methods for monitoring natural habitats, because it can be conducted both from airborne platforms (such as airplanes and drones) and from the ground (terrestrial laser scanning). It is based on the laser signal (pulse) sent and received by the laser scanner. The precise time taken for the signal to travel from the laser scanner to the ground and back is measured. By combining this information with accurate positioning data, we can determine the horizontal positions and elevations of features in the terrain.
Laser scanning provides unique information about the three-dimensional structure of a target. For instance, it accurately captures details such as tree height and the layering of forests. These variables play a significant role in the occurrence of various forest species, such as birds.
Laser scanning in Finland
Laser scanning in Finland has been conducted through comprehensive national campaigns using aircraft. The first such campaign took place from 2008 to 2019, covering the entire country. The primary purpose of the campaign, commissioned by the National Land Survey of Finland (Maanmittauslaitos, MML), was data collection for modeling terrain elevation and forest resources, and the resulting dataset turned out to be quite heterogeneous due to the campaign’s extended duration and involvement of numerous subcontractors.
A second national laser scanning program began in 2020. In this program, the entire country, except for the northernmost Lapland region, is scanned in six-year cycles (MML 2023). Approximately 55,000 km² of land is scanned annually, with a point density of 5 points per square meter. The resulting data is used to create both a digital elevation model and a canopy height model.
One of the challenges in remote sensing has always been how to obtain observations from below the canopy layer when looking from above. Optical remote sensing cannot achieve this, but longer-wavelength SAR (Synthetic Aperture Radar) and airborne laser scanning (LiDAR) can partially address it. One solution to this problem is to bring the laser scanner down to ground level, which is known as terrestrial laser scanning. This approach provides three-dimensional information about both the canopy structure and the understory vegetation. The scanner can also be mounted on a vehicle (such as an ATV or boat), allowing for larger area coverage.
The structural features of forests collected through terrestrial laser scanning, such as vertical layering combined with horizontal variation, effectively differentiate even-aged stands from mixed-age forests. These structural features can be useful for describing ecosystem functioning, species diversity, or local climate conditions.
Usability and availability of satellite data in terms of nature monitoring
The utilization of remote sensing data for monitoring natural habitats has been relatively limited until recent years. Several factors have contributed to this:
- Costs of data and software
- Regional variability in data availability
- Complex preprocessing requirements of the data sets
- Methodological development challenges
- Lack of representative field observations
The usability and availability of satellite remote sensing data have significantly improved over the past decade. Several key factors have contributed to this positive trend.
Several national agencies have opened up their image archives for research purposes. For instance, the United States Geological Survey’s Landsat and the European Space Agency’s Sentinel satellite data are entirely open-access.
Data providers have shifted towards distributing so-called Analysis Ready Data (ARD). ARD refers to pre-processed image data, allowing users to choose the most suitable product options for their needs and proceed directly to the analysis phase. This approach has expanded the usability of remote sensing data across various applications. Standardized, peer-reviewed, well-documented, and openly processed images enhance comparability over time and across datasets. Results are more reliable compared to the previous situation when individual users processed images with varying levels of expertise and inconsistent outcomes.
Rapid developments in open-source software and computing power, especially through cloud services, have been crucial. Users no longer need to download and process data on their local machines. Instead, all processing and analysis steps occur within specialized cloud platforms designed for remote sensing data. These platforms provide ready-to-use datasets, accessible via web browsers (Vihervaara et al. 2019). Such services include e.g.
- CSC (IT Center for Science in Finland) cloud computing services
- EU’s Copernicus programme Data and Information Access Services (DIAS)
- SentinelHub
- Numerous other commercial service providers
The increasing number of satellites in the atmosphere has also contributed to the temporal resolution of satellite imagery: different satellites passing over the same area can capture images as frequently as daily. This enables more precise monitoring of environmental changes and increases the likelihood of obtaining cloud-free images of the region.
References
Aalto, I., Aalto, J., Hancock, S., Valkonen, S., Maeda, E.E. (2023): Quantifying the impact of management on the three-dimensional structure of boreal forests. Forest Ecology and Management 535: 120885. https://doi.org/10.1016/j.foreco.2023.(you are switching to another service)
Cawse-Nicholson, K.; Townsend, P.A.; Schimel, D.; Assiri, A.M.; Blake, P.L.; Buongiorno, M.F.; Campbell, P.; Carmon, N.;Casey, K.A.; Correa-Pabón, R.E.; et al. (2021): NASA’s surface biology and geology designated observable: Aperspective on surface imaging algorithms. Remote Sensing of Environment 257: 112349.
https://doi.org/10.1016/j.rse.2021.112349(you are switching to another service)
Claverie, M., Ju, J., Masek, J.G., Dungan, J.L., Vermote, E.F., Roger, J.-C., Skakun, S.V. & Justice, C. (2018): The Harmonized Landsat and Sentinel-2 surface reflectance data set, Remote Sensing of Environment 219/2018, s. 145–161. https://doi.org/10.1016/j.rse.2018.09.002(you are switching to another service)
Cogliati, S.; Sarti, F.; Chiarantini, L.; Cosi, M.; Lorusso, R.; Lopinto, E.; Miglietta, F.; Genesio, L.; Guanter, L.; Damm, A.; et al. (2021). The PRISMA imaging spectroscopy mission: Overview and first performance analysis. Remote Sensing of Environment 262: 112499. https://doi.org/10.1016/j.rse.2021.112499(you are switching to another service)
Drusch, M., Del Bello, U., Carlier, S., Colin, O., Fernandez, V., Gascon, F., Hoersch, B., Isola, C. et al. (2012): Sentinel-2: ESA’s Optical High-Resolution Mission for GMES Operational Services, Remote Sensing of Environment 120/2012, s. 25–36. https://doi.org/10.1016/j.rse.2011.11.026(you are switching to another service)
Dwyer, J., Roy, D., Sauer, B., Jenkerson, C., Zhang, H. & Lymburner, L. (2018): Analysis Ready Data: Enabling Analysis of the Landsat Archive, Remote Sensing 10/2018. https://doi.org/10.3390/rs10091363(you are switching to another service)
Forsmoo, J., Anderson, K., Macleod, C. J. A., Wilkinson, M. E., Brazier, R. (2018): Drone-based structure-from-motion photogrammetry captures grassland sward height variability. Journal of Applied Ecology 55(6): 2587-2599. https://doi.org/10.1111/1365-2664.13148(you are switching to another service)
Gao, Q., Zribi, M., Escorihuela, M. J. & Baghdadi, N. 2017: Synergetic Use of Sentinel-1 and Sentinel-2 Data for Soil Moisture Mapping at 100 m Resolution. Sensors 17(9):1966.
Geologian tutkimuskeskus (GTK) (2018): Geofysikaaliset matalalentokartat 1:20 000 (metatietokuvaus). https://tupa.gtk.fi/paikkatieto/meta/lentogeofysikaaliset_matalalentokartat_20k.html(you are switching to another service)
Guanter, L.; Kaufmann, H.; Segl, K.; Foerster, S.; Rogass, C.; Chabrillat, S.; Kuester, T.; Hollstein, A.; Rossner, G.; Chlebek, C.; et al. (2015): The EnMAP Spaceborne Imaging Spectroscopy Mission for Earth Observation. Remote Sensing 2015( 7): 8830–8857. http://dx.doi.org/10.3390/rs70708830(you are switching to another service)
Hancock, Essery, R., Reid, T., Carle, J., Baxter, R., Rutter, N., Huntley, B. (2014): Characterising forest gap fraction with terrestrial lidar and photography: an examination of relative limitations. Agricultural and Forest Meteorology 189-190: 105-114. https://doi.org/10.1016/j.agrformet.2014.01.012(you are switching to another service)
Hua, L. & Shao, G. 2016: The progress of operational forest fire monitoring with infrared remote sensing. Journal of Forestry Research 28(2):1–15.
Iglhaut, J., Cabo, C., Puliti, S., Piermattei, L., O’Connor, J., Rosette, J. (2019): Structure from Motion Photogrammetry in Forestry: a Review. Current Forestry Reports 5, 155-168. https://doi.org/10.1007/s40725-019-00094-3(you are switching to another service)
Karjalainen, M., U. Pyysalo, K. Karila & J. Hyyppä (2009): Forest biomass estimation using Alos Palsar images in challenging natural forest area in Finland. Proceedings of the 2008 Joint PI Symposium of the ALOS Data Nodes, Rhodes, Greece, 3 to 7 November 2008. ESA Special Publication SP-664. http://lib.tkk.fi/Diss/2010/isbn9789517112819/article6.pdf(you are switching to another service)
Kuzmin, A., Korhonen, L., Kivinen, S., Hurskainen, P., Korpelainen, P., Tanhuanpää, T., Maltamo, M., Vihervaara, P. & Kumpula, T. (2021): Detection of European Aspen (Populus tremula L.) Based on an Unmanned Aerial Vehicle Approach in Boreal Forests. Remote Sensing 13(9): 1723. https://doi.org/10.3390/rs13091723(you are switching to another service)
Middleton, M., Laatikainen, M., Kivilompolo, J., Harju, A., Lerssi, J., Valkama, M., Pitkänen, T., Pohjankukka, J., Balazs, A., Tuominen, S., Zelioli, L., Farahnakian, F., Nevalainen, P., Heikkonen, J. & Rehell, S. 2022: Preliminary results of the MaaTi peatland database piloting stage. Geological Survey of Finland, Information solutions unit. Rovaniemi.
Mononen, L., P. Vihervaara, T. Repo, K.T. Korhonen, A., Ihalainen & T. Kumpula (2017): Comparative study on biophysical ecosystem service mapping methods – A test case of carbon stocks in Finnish Forest Lapland. Ecological Indicators 73/2017: 544-553. http://dx.doi.org/10.1016/j.ecolind.2016.10.003(you are switching to another service)
Mäyrä, J., Keski-Saari, S., Kivinen, S., Tanhuanpää, T., Hurskainen, P., Kullberg, P., Poikolainen, L., Viinikka, A., Tuominen, S., Kumpula, T. & Vihervaara, P. 2021: Tree species classification from airborne hyperspectral and LiDAR data using 3D convolutional neural networks. Remote Sensing of Environment 256:1–16. https://doi.org/10.1016/j.rse.2021.112322(you are switching to another service)
Nagendra, H., L. Richard, J.P. Honrado, R.H.G. Jongman, R.H.G., C. Tarantino, M. Adamo & P. Mairota, P. (2013): Remote sensing for conservation monitoring: Assessing protected areas, habitat extent, habitat condition, species diversity, and threats. Ecological Indicators 33/2013: 45-59. https://doi.org/10.1016/j.ecolind.2012.09.014(you are switching to another service)
Nevalainen, O., E. Honkavaara, S. Tuominen, N. Viljanen, T. Hakala, X. Yu, J. Hyyppä, H. Saari, Pölönen, I., Imai, N. N., Tommaselli, A. M. G. (2017): Individual Tree Detection and Classification with UAV-Based Photogrammetric Point Clouds and Hyperspectral Imaging. Remote Sensing 9/2017, 185. https://doi.org/10.3390/rs9030185(you are switching to another service)
Quegan, S., Toan, L. T., Chave, J. et al. (2019): The European Space Agency BIOMASS mission: Measuring forest above-ground biomass from space. Remote Sensing of Environment 227: 44-60. https://doi.org/10.1016/j.rse.2019.03.032(you are switching to another service)
Rast, M.; Ananasso, C.; Bach, H.; Ben-Dor, E.; Chabrillat, S.; Colombo, R.; Del Bello, U.; Feret, J.; Giardino, C.; Green, R.; et al. (2019): Copernicus Hyperspectral Imaging Mission for the Environment: Mission Requirements Document, 2.1st ed.; Number ESA-EOPSMCHIM-MRD-3216 in Mission Requirements Document (MRD); European Space Agency (ESA): Paris, France.
Rautiainen, M., Hovi, A., Kuusinen, N., Juola, J., Forsström, P., Salko, S.-S., Schraik, D. & Burdun, I. 2022: Avoimia spektrikirjastoja Suomen metsistä. Metsätieteen aikakauskirja 2022-10734. Puheenvuoro. 2 s.
Upadhyay, P.; Czerkawski M.; Davison, C.; Cardona, J.; Macdonald, M.; Andonovic, I.; Michie, C.; Atkinson, R.; Papadopoulou, N.; Nikas, K.; et al. (2022): A Flexible Multi-Temporal and Multi-Modal Framework for Sentinel-1 and Sentinel-2 Analysis Ready Data. Remote Sensing 2022, 14, 1120. https://doi.org/10.3390/rs14051120(you are switching to another service)
Vihervaara, P., L. Mononen, A.-P. Auvinen, R. Virkkala, Y. Lü, I. Pippuri, P. Packalen, R. Valbuena & J. Valkama (2015): How to integrate remotely sensed data and biodiversity for ecosystem assessments at landscape scale. Landscape Ecology 3/2015: 501-516. http://dx.doi.org/10.1007/s10980-014-0137-5(you are switching to another service)
Vihervaara, P., Kullberg, P., Hurskainen, P. 2019: Biodiversiteetin mittaaminen ja uudet menetelmät. Futura 3/19.
Viinikka, A., Hurskainen, P., Keski-Saari, S., Kivinen, S., Tanhuanpää, T., Mäyrä, J., Poikolainen, L., Vihervaara, P. & Kumpula, T. (2020): Detecting European Aspen (Populus tremula L.) in Boreal Forests Using Airborne Hyperspectral and Airborne Laser Scanning Data. Remote Sensing 12(16): 2610. https://doi.org/10.3390/rs12162610(you are switching to another service)
Woodcock, C.E., R. Allen, M. Anderson, A. Belward, R. Bindschadler, W. Cohen, F. Gao, S.N. Goward, et al. (2008): Free Access to Landsat Imagery, Science 320/2008, 1011a. http://dx.doi.org/10.1126/science.320.5879.1011a(you are switching to another service)
Westoby, M. J., Brasington, J., Glasser, N. F., Hambrey, M. J., Reynolds, J. M. (2012): ‘Structure-from-Motion’ photogrammetry: A low-cost, effective tool for geoscience applications. Geomorphology 179, 300-314. https://doi.org/10.1016/j.geomorph.2012.08.021(you are switching to another service)
White, J.C., C. Gómez, M.A. Wulder & N.C. Coops (2010): Characterizing temperate forest structural and spectraldiversity with Hyperion EO-1 data. Remote Sensing of Environment 7/2010: 1576-1589.
Wulder, M.A., J.G. Masek, W.B. Cohen, T.R. Loveland & C.E. Woodcock (2012): Opening the archive: how free data has enabled the science and monitoring promise of Landsat, Remote Sensing of Environment 122/2012, s. 2–10. https://doi.org/10.1016/j.rse.2012.01.010(you are switching to another service)
Wulder, M.A., N.C. Coops, D.P. Roy, J.C. White & T. Hermosilla (2018): Land cover 2.0, International Journal of Remote Sensing 12/2018, s. 4254–4284. https://doi.org/10.1080/01431161.2018.1452075(you are switching to another service)
Yrttimaa, T., Saarinen, N., Kankare, V., Hynynen, J., Huuskonen, S., Holopainen, M., Hyyppä, J., Vastaranta, M. (2020): Performance of terrestrial laser scanning to characterize managed Scots pine (Pinus sylvestris L.) stands is dependent on forest structural variation. ISPRS Journal of Photogrammetry and Remote Sensing 16b (2020): 277-287. https://doi.org/10.1016/j.isprsjprs.2020.08.017(you are switching to another service)